Tag: Tax, Spending & the Budget

  • Job Creation Record Contradicts Tax-Cut Ideology

    The Australian Bureau of Statistics released its detailed biennial survey of employment arrangements this week (Catalogue 6306.0, “Employee Earnings and Hours“). Once every two years, it takes a deeper dive into various aspects of work life.

    Buried deep in the dozens of statistical tables was a very surprising breakdown of employment by size of workplace. It turns out, surprisingly, that Australia’s biggest workplaces (both private firms and public-sector agencies) have been the leaders of job-creation over the last two years.

    This runs against the common refrain that small business is the “engine of growth.” In fact, workplaces with less than 50 employees actually shed employees (14,000 in total) since 2016. Curiously, it was only smaller businesses that received the much-vaunted reduction in company tax (from 30 to 27.5 per cent), also beginning in 2016.

    Firm Size and Job Creation

    The tax rate for small and medium-sized businesses began to fall in 2016, first for the smallest firms (with turnover under $2 million), and then for firms with up to $50 million revenue. The tax is not tied to the number of employees in a business, but the vast majority of firms which have received the tax cut have less than 50 employees. Yet that is the group that has reduced its workforce since the tax cuts began to be phased in.

    In contrast, very large workplaces (with over 1000 employees) added 182,000 new jobs over the two years. Workplaces with between 100 and 1000 employees added 187,000. Very few of those workplaces would have received the reduction in company taxes (since most would exceed the $50 million annual revenue threshold).

    Workplaces between 50 and 100 employees created a net total of 103,000 new jobs between 2016 and 2018. Some of those firms would have received the tax cut, and some not — depending on the nature of the business and the amount of total turnover generated per employee.

    The data on job-creation by firm size is detailed on Table 13 of Data Cube 1, in the “Downloads” section of the ABS report. The data refers to waged employees, not including owner-managers of businesses.

    The share of small businesses (under 50 employees) in total employment declined by two percentage points — since they were reducing their workforces, while larger companies were growing. Small businesses (under 50 employees) now account for 34 per cent of all employees, compared to 36 percent in 2016.

    Why would large companies that didn’t get a tax cut create new jobs faster than companies which did benefit from the Coalition tax cuts? (The small business tax cuts are estimated to reduce federal revenues by $29.8 billion over the first decade.) Simple: there are dozens of different factors which determine whether a company is profitable or not, and whether it chooses to grow. Tax rates are just one of those variables. Others include:

    • Growth in consumer demand.
    • The company’s investments in product quality, innovation, and design.
    • Production costs.
    • Interest rates and financing costs.
    • Business confidence and expectations.
    • Management capacity.
    • International competition.

    Trends in all these other factors can easily overwhelm the marginal impact of lower tax rates. Small business sales in particular have been held back by stagnant wages among Australian workers. Even companies which experience higher profits due to lower tax rates may choose to simply accumulate those profits, or pay them out to shareholders in dividends and share buy-backs (instead of expanding payrolls). Empirical evidence shows this has been the dominant impact of U.S. business tax cuts implemented by Donald Trump.

    Changes in tax rates can even have offsetting effects which undermine business conditions and hence reduce job-creation: if the revenue lost to tax cuts results in corresponding reductions in government program spending or infrastructure investments (as seems likely), then overall business conditions might be weakened, not strengthened.

    The reduction in employment by the businesses which most benefited from the expensive business tax cuts over the past two years should lead policy-makers of all persuasions to reconsider the argument that this is an effective way to stimulate growth and job-creation. However, in October the government announced it wanted to accelerate the next stages of the small business tax cuts — taking the rate down to 25 per cent five years faster than originally planned.

    So far, the policy is akin to shooting oneself in the foot. Instead of reloading the gun to do it again even sooner, perhaps this is a good time to reconsider whether the strategy makes any sense at all.

    The post Job Creation Record Contradicts Tax-Cut Ideology appeared first on The Australia Institute's Centre for Future Work.

  • Government Spending Power Could Support Stronger Wage Growth

    New research from the Centre for Future Work at The Australia Institute demonstrates a strong connection between government spending and working conditions across the economy.

    “Weak labour market conditions, including record-weak wage growth, could be improved by linking public spending in all forms to improved job quality and compensation,” said Dr. Jim Stanford, Director of the Centre for Future Work.

    The Centre for Future Work report finds three main avenues through which government spending could lift wages and working conditions:

    1. Direct work and production undertaken within government and its departments and agencies (the public sector).
    2. Arms-length service-producing organisations which depend on government funding (the non-profit sector).
    3. Private-sector firms which supply government and public agencies with goods and services (the private sector).

    “It is ironic that Treasurers are always praying for stronger wage growth with every year’s budget in order to generate stronger growth and stronger revenues. Yet governments don’t pursue obvious opportunities to actually achieve that wage growth by linking labour standards to their own expenditure policies,” said Dr Stanford.

    “This is clearly a lost opportunity. Australia’s government sector is by far the single largest part of Australia’s economy.

    “This economic footprint, if wielded consistently to achieve higher wages and better jobs, could have a powerful impact on labour market outcomes.”

    Australian government economic footprint at a glance:

    • Total expenditures of over $660 billion per year, equal to 36 percent of Australia’s GDP.
    • Expenditures on current production of public goods and services of over $330 billion per year (18.5 percent of GDP), and further spending on capital investments of over $85 billion (another 5 percent of GDP).
    • Direct public sector employment of close to 2 million workers, with millions more jobs indirectly dependent on government injections of spending power.
    • Fiscal support for public and community services by arms-length non-profit agencies, worth at least another 4 percent of GDP.
    • Goods and services procured from private-sector suppliers equivalent to around 10 percent of GDP (or about $175 billion per year).

    The post Government Spending Power Could Support Stronger Wage Growth appeared first on The Australia Institute's Centre for Future Work.

  • Don’t blame it on the deficit: WA

    Contrary to calls for fiscal austerity and public sector downsizing, being made in response to the emergence of fiscal deficits in WA, the report showed that budget deficits played a useful role in stabilizing the economy during times of economic downturn, and will automatically recede as the economy recovers.

    “In reality there should be no alarm about the WA state deficit. Deficits are acceptable, and positive, during periods of weak economic growth.” says the Australia Institute’s Senior Economist, Dr. Cameron Murray.

    “In fact, that deficit merely confirms that state fiscal policy is doing what it is supposed to: providing essential public services and providing a solid base for private-sector economic activity.”

    “It is wrong to immediately conclude that the only response to a deficit must be some combination of cutting spending, reducing public sector employment, freezing or reducing public sector wages, and selling public assets.”

    The report found public sector payrolls grew modestly through the 2014-17 period. That modest growth, in contrast to the contraction in private payrolls, supported a cumulative total of $3 billion dollars in additional GDP; $1.3 billion in additional consumer spending; and $450 million in additional state revenues.

    “During WA’s recession we’ve seen compensation growth slow down in both the public and private sectors,” says Murray.

    “Importantly however, the modest, continuing wage growth we did see in the public sector acted as an automatic stabiliser, reducing the severity of WA’s downturn.”

    Total economic activity, including economic activity in the private sector, was also found to be higher as a result of the government slowly but steadily increasing its spending on public servants and the services they provide.

    “Those deficits arose in the wake of the slowdown in mining activity and corresponding deceleration of employment and economic growth, and over-zealous fiscal austerity is not the solution.”

    “Continuing growth in public sector wages and maintaining public spending during weak economic periods generates positive spillover effects for the rest of the economy,” says Murray.

    More recently, positive signs of recovery in the state economy are quickly and automatically producing a reduction in the size of the deficit. The report recommends the state government focus on supporting that continuing recovery, rather than reducing the government’s own contribution to it.

    The post Don’t blame it on the deficit: WA appeared first on The Australia Institute's Centre for Future Work.

  • Scare Tactics for Corporate Tax Cuts Do Not Stand Fact Checks

    “Trump tax cuts: Scott Morrison warns business will abandon Australia while we are at the beach” was the Sydney Morning Herald headline, reporting on the Coalition Government’s scare tactics to press through its tax cuts gift for business. The Treasurer used the opportunity of the Trump tax cuts to issue this “dire” warning. However, his claim does not withstand some basic empirical scrutiny.

    Fact 1: Australia is not a high tax country

    Our overall tax take is one of the lowest among the 35 OECD countries. If Mr. Morrison was correct, then by now there should have been a tsunami of investment flowing here from 27 OECD countries with higher tax-GDP ratios than that of Australia’s 28.2% in 2016. Australia’s overall tax ratio is well below the OECD average of 34%, and also below neighbouring New Zealand’s tax take of 32.1% of GDP.

    Here are reported tax ratios for 27 OECD countries, 2016.

    OECD Tax Shares
    Source: Revenue Statistics 2017 – Australia; https://www.oecd.org/tax/revenue-statistics-australia.pdf

    Fact 2: Australia’s effective corporate tax is far below its statutory 30% rate

    Australian companies may seem to face a higher statutory corporate tax rate, but once they go through all their deductions and credits they don’t end up paying an unusually high amount compared to companies in other nations. The average effective rate (10.4%) is barely one-third the statutory rate. In fact, more than a third of large companies did not pay any corporate taxes in 2016 according to the recently released ATO data.

    Effective vs Statutory Tax Rates
    Source: National Public Radio, based on US Congressional Budget Office data; https://www.npr.org/2017/08/07/541797699/fact-check-does-the-u-s-have-the-highest-corporate-tax-rate-in-the-world

    Fact 3: Tax is low on companies’ lists of factors influencing investment location decision

    For example, the OECD noted, “it is not always clear that a tax reduction is required (or is able) to attract FDI. Where a higher corporate tax burden is matched by well-developed infrastructure, public services and other host country attributes attractive to business… tax competition from relatively low-tax countries not offering similar advantages may not seriously affect location choice. Indeed, a number of large OECD countries with relatively high effective tax rates are very successful in attracting FDI.”

    This is corroborated by the most recent World Bank survey of enterprises, which found that tax incentives are not high on the list of critical factors affecting inflows of foreign direct investment. The IMF’s recent research also reports that the net impact of corporate tax cuts to incentivise private investment is quite often negative on government revenues. The pre-tax profitability of Australian businesses has also tended to exceed that in other countries, and this is surely more important in motivating investment flows.

    Fact 4: Rigorous studies of past US tax cuts did not find a positive link between tax cuts and economic or employment growth

    For example, the oft-cited examples of the Reagan or Bush tax cuts do not in fact demonstrate that tax cuts cause growth. Admitted by President Reagan’s former chief economist, Martin Feldstein, the vast majority of growth during the Reagan era was due to expansionary monetary policy that slashed interest rates massively to help the economy bounce back from a severe recession in 1982. Increased defence spending and an expanded labour force due to an influx of baby boomers also boosted the economy. In another study with Doug Elmendorf, the former Congressional Budget Office Director, Martin Feldstein found no evidence that the 1981 tax cuts increased employment.

    The 2001 and 2003 Bush tax cuts also failed to spur growth. Between 2001 and 2007 the economy grew at a lacklustre pace—real per-capita income rose by 1.5% annually, compared to 2.3% over the 1950-2001 period. Interestingly, the two sectors that grew most rapidly in this period were housing and finance, which were not affected by the 2001 and 2003 tax cuts. Moreover, by 2006, prime-age males were working the same hours as in 2000 (before the tax cuts), and women were working less – both facts inconsistent with the view that lower tax rates raise labour supply.

    Fact 5: The most infamous case of tax cuts in the US State of Kansas was a colossal failure

    Governor Sam Brownback promised that a moderate tax cut for individuals and a big tax cut for businesses would be “like a shot of adrenaline into the heart of the Kansas economy.” Unfortunately, however, despite his 2012 tax cuts, the Kansas economy remained moribund, while neighbouring states surged ahead. In the process, the Kansas state budget was left in tatters. No wonder that the Republican-led state legislature reversed most of Brownback’s tax cuts in the face of poor growth and pressing public spending needs.

    Therefore, if Mr. Morrison is serious about repairing the budget, or stimulating growth and employment, then he should be concentrating on raising more revenues (not less) and investing in the nation – instead of cutting basic services to fund his tax cuts for the rich. He should be looking at the facts, instead of resorting to scare tactics.

    The post Scare Tactics for Corporate Tax Cuts Do Not Stand Fact Checks appeared first on The Australia Institute's Centre for Future Work.

  • Budget Wrap-Up

    Wage Growth and Deficit Reduction

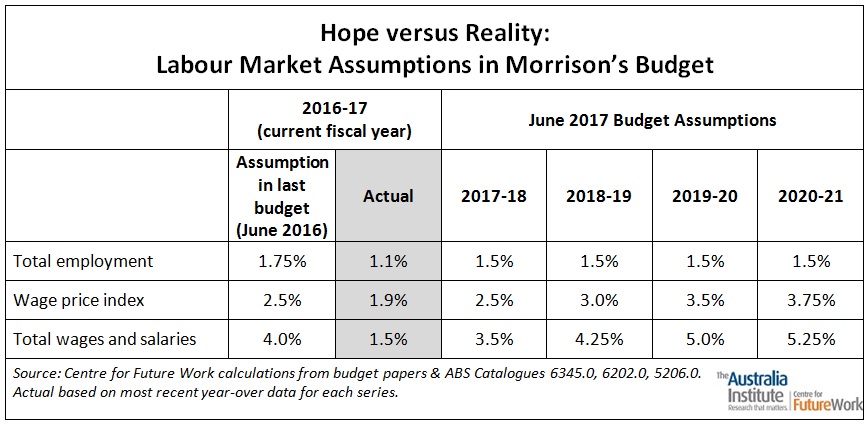
    Several commentators have highlighted the budget’s highly optimistic assumptions regarding future job-creation and wage growth incorporated into the budget forecast. The government is anticipating an immediate and sustained acceleration of all of the factors that contribute to the wage base for tax revenue: faster job-creation, significantly faster growth in hourly pay, and dramatically faster growth in total wages and salaries.

    Back in the real world, the labour market has been underperforming on ALL THREE of those components: slow job-growth, record slow growth in hourly wages, and falling weekly hours of work (due to the dramatic expansion of part-time and irregular work). For all of these reasons, total wages and salaries paid out in the economy (which forms the major basis for personal tax collections, both income and GST) actually declined in the latest quarter of GDP (Dec 2016).

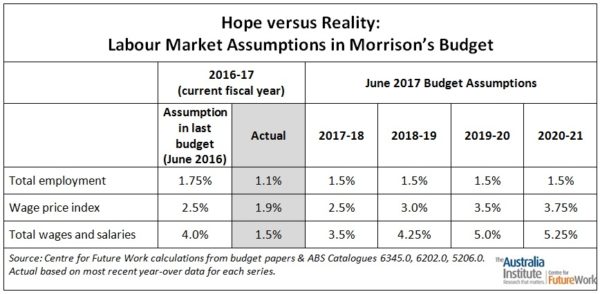
    This table summarises the main wage assumptions in Mr. Morrison’s budget, contrasting them to the latest actual figures on each of the three criteria. The last budget (2016-17) missed the mark badly on all three criteria — but the likely undershooting error will be huge by the end of this budget’s forward estimates, unless there is a dramatic and sustained acceleration of employment and wages growth.

    Director Jim Stanford pointed out in this Huffington Post column that the current weakness in Australian wages is not an accident, nor is it likely to reverse automatically. Chronically weak aggregate labour market conditions, combined with structural attacks on the institutions that support wages (including unions, minimum wages, penalty rates, and others), have caused the unprecedented stagnation of wage incomes in Australia. The macroeconomic consequences of this state of affairs have been widely acknowledged — even by the government itself. (Mr. Morrison himself spoke recently of his concern with the impact of wage stagnation on his own budget targets.)

    As Stanford put it in his Huffington Post commentary, the contradiction between the government’s wage-suppressing economic and regulatory policies, and its hope that wage growth will nevertheless power the way to a balanced budget, is both glaring and unsustainable:

    “[Morrison’s] rose-coloured labour market assumptions will be sabotaged by his own government’s continuing war on workers and wages. And that’s one important reason why his hopeful deficit targets will not be realised.”

    General Optimism Regarding Revenue

    The budget’s optimistic wage growth assumptions are just one factor behind an overall revenue forecast that is downright ebullient. The main force behind the projected return to a balanced budget is an enormous assumed increase in tax revenues — very ironic coming from a government that regularly derides the alleged “tax-and-spend” procilivities of its opponents. Over the four years of the forward projection, annual revenues are expected to expand $120 billion by 2020-21 (or 30 percent). As a share of GDP, revenues are expected to swell by 2.2 percentage points, reaching the highest share (25.4% of GDP) since the peak of the mining boom (in 2005-06).

    There is no clear explanation of where these huge new revenues come from – especially given the revenue-reducing effect of other budget measures, including company tax cuts, the elimination of the deficit repair levy for high-income earners, last year’s bracket adjustments, and others. There are some modest revenue measures in the budget: including the 0.5% Medicare levy increase (after 2019), the levy on bank liabilities, and a new levy on employers who hire migrant labour. But those policy decisions account for just 6.5% of all new revenues assumed to be received over the coming 4 years — and they will be more than offset by the revenue losses from the other measures (especially the company tax cuts).

    If revenues stay constant as a share of GDP (instead of magically growing), the budget will be $45 billion short in 2020-21 – and the forecast small surplus will evaporate into a large continuing deficit. Indeed, as our colleagues at the Australia Institute have pointed out, this budget marks the fourth consecutive four-year LNP timetable for balancing the budget. The government’s tough talk on the dangers of deficit-financing, and stated intention to quickly achieve balance, have proven hollow. Many of its proposed spending cutbacks have been successfully resisted by community campaigning. And its rosy revenue forecasts have been consistently unfounded. There is no reason to believe this year’s four-year deficit elimination timetable is any more realistic than the last three.

    Robbing Peter to Pay Paul

    On the spending side, the government is announcing some modest new spending initiatives, totaling $9 billion over 4 years.

    But at the same time, they are announcing spending cuts to a wide range of programs (including higher education, welfare, and civil servants) – totaling $10 billion over the same period.

    The net impact of new policy decisions on spending is therefore $1 billion in the negative. Despite the promise of “better times” in the future, the government’s discretionary actions will reduce aggregate funding for the programs that Australians depend on.

    A Target Everyone Can Love: The Big Banks

    The government’s new 6 basis point “levy” on bank liabilities (ie. on outstanding loans) is forecast to raise $6.2 billion over 4 years.

    Many analysts believe this tax will be passed on to borrowers (since it is defined as a proportion of lending), and the government has not provided a convincing refutation of this concern. The levy is equivalent to a slight increase in the cost of capital for new lending. (In fact, this new “levy” is smaller than recent increases in interest rates which the banks have already passed on to their borrowers.)

    The government’s claim that the ACCC, with increased funding, will ensure the banks do not pass on the costs of the levy is laughable — as is its claims that competition from smaller banks will keep the big banks in line. Unless there is outright collusion and price-setting between the banks (something that is rare and unnecessary anyway), there is nothing illegal about passing on higher costs to consumers. Indeed, the ability to do this is precisely what explains the banks’ consistent above-normal profits (earning return on equity of 15 percent or more each and every year).

    At any rate, once the banks start to benefit from the full 5% reduction in their own corporate taxes (by 2026-27), they will still be saving billions each year on a net basis.

    The eminent economist Prof. Geoffrey Harcourt, a good friend of our Centre, put it this way in a blog comment:

    “The discussions on the levy/tax on the big four banks in the 2017 budget are often hysterical and beside the point. Because banks play an essential role in the running of the economy, they need protection through a guarantee from the government. Because of their oligopolistic market structure, they are in a privileged position to make large profits, a portion of which reflects their necessary privileged position, rather than any merit of their own. Common sense suggests that it would be both efficient and equitable that the banks be allowed to receive, say, the average rate of profits ruling in the economy as a whole without being taxed differently than any other form of enterprise in Australia. If their overall rates of profit are greater than the average – which they certainly are – the differences between the two sets of rates should be subject to a higher rate of tax so that the community at large receives a return on the privileged position the banks have been necessarily granted. The proposed levy is roughly akin to this proposal, which is tackling an equitable puzzle. It should not, in principle, be related to what is happening to the budget overall and especially to the sizes of any deficits or surpluses. These should reflect the outcome of attempting to meet the real aims of good government starting with achieving and sustaining full employment and sustainable growth.”

    Infrastructure Spending: Show Us the Money

    The government is boasting of $75 billion in infrastructure funding and financing over the next ten years. It is impossible to know how much of this represents new funds, nor when the funds would be delivered. Keep in mind that at present the government already spends over $18 billion per year on capital (or $200 billion over the next decade): both on new projects, and offsetting the wear and tear of existing assets. So the $75 billion “plan” ($7.5 billion per year) may or may not represent a substantial ramp-up in new capital spending by Canberra.

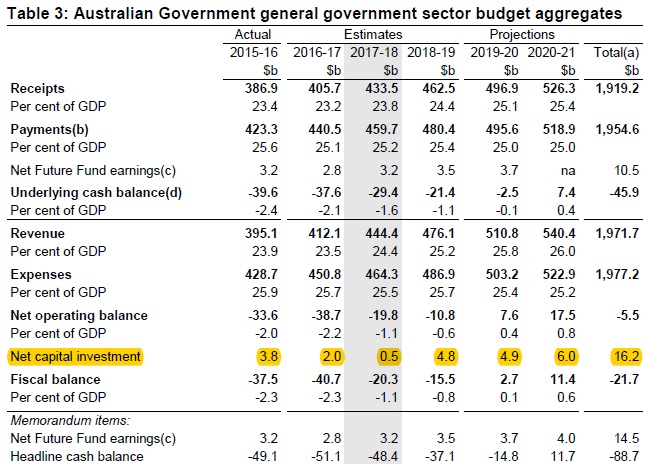
    In fact, the details of the budget do not seem to indicate any enormous expansion in capital spending. Net capital spending (after depreciation) is projected to decline in 2017-18: to just $0.5 billion, the smallest since 2002-03. (See Budget Table 3, reprinted below.) In essence, in the first year of the budget, the government will spend barely enough to offset depreciation of existing assets.

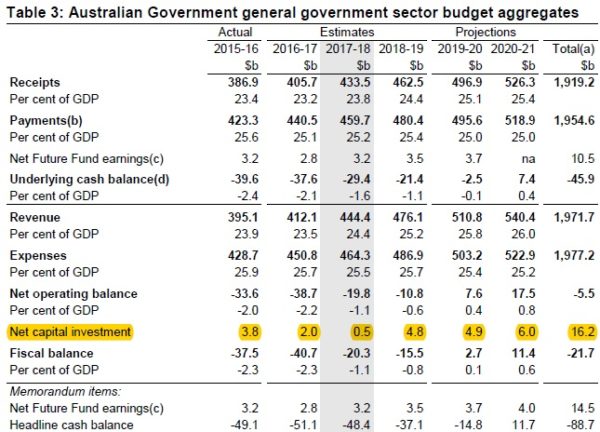
    Net investment grows in later years, but not dramatically. And as a share of GDP, net capital spending by the Commonwealth is projected to average just 0.2% of GDP over the forward projections. Over the last ten years, in contrast, it averaged 0.25% of GDP. In other words, under this budget, net Commonwealth capital spending will actually shrink relative to the economy.

    It is easy to come up with “big numbers” when talking about infrastructure programs (especially by summing totals over many years), and associated ribbon-cutting ceremonies will attract much attention. But there is no concrete evidence that this budget will accomplish the real and sustained increase in Commonwealth government capital spending that is needed. Commonwealth capital spending has declined in recent years compared to earlier decades, and there is no evidence that this budget will change that trend.

    Migrant Labour and Apprentices

    The government is imposing a new “head tax” on employers who hire foreign migrants: $1200 to $1800 per year per head for temporary migrants, and $3000 to $5000 for each permanent migrant (on a one-time basis). The revenues from this levy will be used to fund support for apprenticeships in conjunction with the states, to a total of $1.2 billion over the next 4 years.

    Funding skill programs through a tax on migrant labour is not an effective way to rebuild Australia’s battered vocational education system – nor is it an effective way to regulate employers’ over-reliance on temporary foreign migrants (rather than recruiting and training Australian workers). Indeed, the scale of revenues anticipated by the government suggests that incoming migrant labour will continue to constitute a major force in Australia’s labour market.

    Effectively regulating and reforming Australia’s migrant labour system – limiting its use to classifications where skilled workers are truly unavailable, and ensuring that migrant workers are entitled to the same protections as all other workers – would in fact undermine the head tax revenues that the government is now counting on.

    Check Out The Australia Institute’s Budget Analysis

    Our colleagues at the Australia Institute have also generated some useful and punchy commentary on the budget: see it all (including a hilarious podcast with economists Richard Denniss and Matt Grudnoff) on the Institute’s Budget Wrap page.

    The post Budget Wrap-Up appeared first on The Australia Institute's Centre for Future Work.

  • Bracket Creep Is A Phoney Menace

    Other thresholds don’t change. Taxpayers making over $80,000 will thus get a small saving ($6 per week at most). Those who make less, get nothing.

    It’s not the most expensive tax cut in the budget. It will cost an estimated $800 million in the first year – barely half the $1.5 billion lost annually by cancelling the deficit repair levy on incomes over $180,000, and far less than the ultimate cost of Morrison’s company tax cuts. But it is the most transparent and easy to understand of all the budget’s tax measures. And it will spark the most gossip around the water-cooler. Who makes over $80,000 per year, anyway? And who makes less? It’s hard to imagine a more “us versus them” tax policy.

    The Treasurer’s own rhetoric reinforces this schism: he says it will “reward hard working Australians,” encourage them to work overtime, take more shifts, and accept a promotion. The clear implication is that people making less than $80,000 are not interested in working more hours or taking promotions. Indeed, they aren’t even “hard working” in the Treasurer’s terms, and hence don’t merit protection from “creeping” taxes.

    The Treasurer tried, but failed, to define the measure as one that benefits “average” wage-earners. Mean annual earnings for a full-time worker employed year-round are indeed near $80,000. But this does not remotely describe the typical Australian. First off, the mathematical “average” is skewed upward by super-high incomes at the top of the income ladder; the median full-time wage (received by the full-time worker in the exact middle of the distribution) is $10,000 lower than the average, and well below the threshold. Likewise, women (even those employed full-time year-round) earn $10,000 less than the mathematical mean.

    Federal Treasurer Scott Morrison delivering his first budget, in 2016.
    Federal Treasurer Scott Morrison delivering his first budget, in 2016.

    But the bigger problem is that a shrinking share of Australians have full-time permanent jobs to start with. Part-time work now accounts for almost one in three jobs – the highest on record. And labour hire, temporary contract, and other forms of precarious work are increasingly the norm. Very few of those workers earn anywhere near $80,000. At most about one in four Australian workers (and perhaps 15 per cent of all tax-filers) will get the full $6 per week saving.

    The whole concept of “bracket creep” is itself as misleading as Morrison’s maths. He says taxpayers are “pushed” into higher tax brackets by rising incomes, constituting a punitive and underhanded tax grab. But this description merits some careful second thought.

    There are two different reasons why a worker’s income might rise. One is pure inflation, experienced across all wages and prices. In that case, nothing “real” changes, and a higher tax rate might seem unfair (although we should remember that the cost of many government programs also grows with inflation, and someone has to pay for that).

    Alternatively, it might be changes in a worker’s real income that qualify them for the next bracket. If they worked more hours or took a promotion (as the Treasurer urges), then their real income rises, and so does their tax. That’s not bracket creep, and there’s nothing “underhanded” about it. In fact, that is the whole point of a personal income tax system in which tax rates depend on income.

    Moral panic over bracket creep is all the more ironic given the unprecedented stagnation in Australian wages, reflecting sustained weakness in the job market. Average weekly earnings in the private sector are growing at their slowest pace in history: under 1 per cent per year (slower than inflation). The budget itself acknowledged this is badly hurting Commonwealth revenues. With wages going nowhere fast, this is hardly the time in history to make a mountain out of a bracket creep molehill.

    If the government truly wanted to prevent inflation from distorting taxes, it could simply index all parameters in the tax code to consumer prices (as other countries, like the U.S. and Canada, have done). Then all thresholds, not just the one cherry-picked by Morrison, would rise 1.3 per cent this year, the same as year-over-year inflation. But that would depoliticise the whole process, hardly acceptable in a year when every single clause of the budget is focused on getting the government re-elected. So Morrison picked one politically-potent threshold, lifted it seven times faster than inflation, and left everyone else to get “creeped.”

    Previous ad-hoc increases to thresholds have lifted them far faster than inflation. In fact, with this latest increase, the third tax threshold will have risen twice as much as inflation since 2003. Combined with rate reductions also targeted at top brackets during that time, government revenues have been undermined badly, and the upward redistribution of after-tax income has been exacerbated.

    In short, the politics of Morrison’s over/under game are hard to understand. He will deliver a tiny benefit to less than one in four employed workers, and barely one in seven tax-filers. Most Australians won’t get a cent. But the economics are even worse. His divisive and false anti-tax narrative undermines the long-run stability of the government’s revenue base, damages public services, and reinforces inequality.

    The post Bracket Creep Is A Phoney Menace appeared first on The Australia Institute's Centre for Future Work.

  • State Income Taxes Would Promote Inequality and Debt

    The latest “big idea” on tax policy from the Coalition government is to grant independent income tax powers to the states. This would be accompanied by a devolution of funding responsibility for big-ticket services like health care, hospitals, and schools. Prime Minister Turnbull argues that forcing state governments to raise the money they spend will lead to more accountability and efficiency in public service delivery. And it’s a politically convenient response to the demands from states for more revenues: “If you need it so much, go out and raise it yourself.”

    While this trial balloon serves a short-run political function for a government struggling to define its agenda, it would be a terrible way to organize long-run fiscal affairs in a diverse, federal country. Canada’s experience with tax devolution is an appropriate cautionary tale. Like Australia, Canada is a federal country with a complex division of government responsibilities, a vast resource-dependent economy, and big economic and social gaps between regions.

    Canada’s ten provinces have the power to set their own personal income and company taxes. They also set province-specific GST rates. The result is enormous variation in tax rates (and rules). Top marginal provincial income tax rates range from 11.25 percent in Alberta, to over 25 percent in Quebec and New Brunswick. Provincial GST rates range from zero in Alberta, to almost 10 percent in Quebec. In each case, provincial taxes are in addition to those levied by the federal government (with its own GST of 5 percent, and a top marginal federal income tax of 33 percent). Each province also sets its own rules regarding coverage, eligible deductions, and tax brackets, complicating inter-provincial business.

    It’s not just that individuals must pay tax twice, to different levels of government. (In fact, at tax-filing time, taxpayers must fill out two forms to separately determine what they owe to the federal and provincial governments.) More damaging are the long-run fiscal and social mechanisms set in motion by interprovincial tax disharmony.

    Provinces enjoying stronger economic conditions can reduce their tax rates, yet still raise adequate revenue. This sparks a destructive race-to-the-bottom in tax rates that undermines government revenues in all provinces.

    The worst example of this occurred during the resource boom of the 2000s. Oil-rich Alberta adopted a low flat-tax applying to all taxpayers (no matter how wealthy). This helped the Conservative government there get reelected. But it exacerbated demands in other provinces (especially neighboring British Columbia and Saskatchewan) to reduce their own taxes in tandem. Well-off Canadians (especially those receiving business or investment income) can easily establish multiple “residences,” allowing them to pay tax in the lowest-rate province.

    Smaller, poorer provinces bear the brunt. Consider New Brunswick, in Canada’s poorer east, with a population of just 750,000. Its top marginal income tax rate is more than twice as high as Alberta’s (and New Brunswickers also pay an 8-point GST premium). This makes it all the harder to retain young talent, attract investment, and catch up to the rest of the country. Underfunding provincial schools won’t help economic recovery, either.

    By undermining fiscal capacity, tax competition has also contributed to the escalation of provincial debt. Some provinces (like New Brunswick) now owe over 40 percent of their GDP in provincial debt (on top of their share of federal debt, another 33 percent of GDP). Alberta and other higher-income provinces have virtually no debt. Yet indebted provinces pay higher interest rates than Ottawa, resulting in many billions of dollars of avoidable debt service charges. It would be much cheaper for both revenues and debts to be managed centrally, minimizing both tax competition and interest rates.

    The Coalition’s most unbelievable claim is that tax devolution will end fiscal squabbles between the governments. That was the theory in Canada in 1977, when the federal government transferred 13.5 percentage points of income tax powers to the provinces, to fund provincially-delivered health and education programs. Forty years later, however, the squabbling is louder than ever. The provinces cannot single-handedly fund public services from their own revenues (especially given the destructive effects of tax competition). So Ottawa still transfers $65 billion per year to the provinces (one-quarter of all federal spending). And debates over those transfers are as intense as ever. Right now, for example, the provinces are furious over a unilateral reduction in federal health transfers.

    Federalism is a messy business. And that’s probably how it should be: the whole idea is to ensure a healthy balance between national and regional interests. But the hope that a one-time tax transfer to lower governments can somehow fix all problems of funding and accountability is pure fantasy.

    The post State Income Taxes Would Promote Inequality and Debt appeared first on The Australia Institute's Centre for Future Work.

  • Company Tax Cuts: A Cautionary Tale from Canada

    Whatever the motive, the constituency most disappointed by this about-face is the corporate sector. Business leaders hoped to ride the coat-tails of a “tax shift” to achieve a significant reduction in company income taxes. And they continue to beat the drum for lower business taxes, financed if necessary from other fiscal savings. By sweetening after-tax returns, they argue, business capital spending will accelerate: driving GDP expansion, more jobs, and fiscal dividends for government. In short, everybody wins.

    But is their promise of a growth dividend realistic?

    Never mind economic models, which depend entirely on whatever assumptions are programmed in by the modelers. Instead, let’s consider some real-world experience to judge whether company tax cuts would indeed generate a significant growth dividend. Canada’s recent experience with deep corporate income tax cuts is especially relevant to Australia, given the structural similarities between the two economies: large geography, dependence on major resource projects, and large inflows of foreign capital.

    CanadaBusinessTax

    The Canadian federal government implemented three successive federal corporate tax reductions over the last generation. (Provincial governments also levy their own corporate taxes, averaging around 10 per cent, added to federal levies.) The first stage occurred in the late 1980s: the statutory rate was reduced from 36 per cent to 28 per cent, but various loopholes and deductions were closed in the process. The second reform occurred early this century: the general rate fell to 21 per cent, and preferences for manufacturing and resources were eliminated. The latest cuts were implemented beginning in 2007 by former Conservative Prime Minister Stephen Harper (defeated in last year’s election): he cut the base rate to 15 per cent, and eliminated a 1.1 per cent CIT surtax. Those last reductions alone still cost the federal government over $15 billion (Canadian Dollars) in foregone revenue each year.

    Together, these successive cuts reduced combined Canadian corporate taxes (including provincial rates, which also fell in several provinces) from near 50 per cent of pre-tax income in the early 1980s, to 26 per cent today. In theory, the resulting boost to profits should have stimulated a strong response in business investment. Unfortunately, hopes for this “jobs and growth” dividend have been repeatedly dashed.

    Instead of growing, business spending on fixed capital (machinery, structures, etc.) declined under lower company taxes, by about one full point of GDP since the reforms began. Business innovation spending (one of Mr. Turnbull’s top priorities) fared even worse: business R&D outlays shrank by over one-third as a share of GDP, to a record low of just 0.8 per cent. In fact, over the last decade real business investment performed worse than during any other era in Canada’s postwar history. Several provincial governments have given up waiting for the promised investment boom, and are now increasing company tax rates to help address chronic deficits.

    It is instructive to compare Canada and Australia’s investment performance over this period. Both countries face the same booms and busts in global commodity prices. Yet in the last decade business spending on fixed assets grew more than twice as fast in Australia, according to OECD data: by 3.9 per cent per year in Australia (after inflation), despite higher company taxes, versus an anemic 1.7 percent in Canada. Canada’s GDP outgrew Australia’s in just two of those ten years, and last year the country slipped into outright recession.

    One especially painful side-effect of lower company taxes has been the sustained accumulation of liquid assets by Canada’s non-financial businesses. Corporate cash hoarding accelerated dramatically after the turn of the century. Non-financial firms now hold cash and other liquid assets equal to over 30 per cent of GDP. IMF researchers have shown that corporate cash holdings grew faster in Canada than any other G7 economy (and twice as fast as in Australia).

    With businesses investing less than they receive in after-tax cash flow, lower taxes only add to the stockpile of idle liquid assets, draining spending power from the economy. In this regard, lower corporate taxes may very well have weakened growth and job-creation, not strengthened it. In any event, Canada’s experience is a sobering reminder to Australian policy-makers: anyone expecting a tax shift to generate a big growth dividend is likely to face chronic disappointment.

    The post Company Tax Cuts: A Cautionary Tale from Canada appeared first on The Australia Institute's Centre for Future Work.